

This study settles the safest month to visit an ice cave in Iceland, using 31 years of daily weather, the flow of three glacial rivers, and 17,779 real bookings. It covers what makes a cave roof fail, why February wins, and how to read a cancellation rate without fooling yourself.
Ask a guide about the safest month to visit ice caves in Iceland and you will get a straight answer. Usually it is February.
The data agrees with the guides. February is our recommendation for ice cave tours in Iceland, and January is the pick if you would rather have the cave to yourself, since it gives up almost nothing on safety.
Why You Can Trust Our Content
Guide to Iceland is the most trusted travel platform in Iceland, helping millions of visitors each year. All our content is written and reviewed by local experts who are deeply familiar with Iceland. You can count on us for accurate, up-to-date, and trustworthy travel advice.
Guide to Iceland analyzed 31 years of daily weather for the southeast, where the ice caves are, the flow of three glacial rivers draining Vatnajokull Glacier, and 17,779 real ice cave bookings covering 46,684 travelers on two different glaciers.
The months of the ice cave season do not come out equal, and the gap between the best and the worst month is far wider than the October to April season suggests. This study covers the ice. For the day of the week and the departure time that give you the emptiest cave and daylight inside it, our companion study on the best time to visit ice caves in Iceland has the answers.
Key Findings
-
February is the safest month to visit an ice cave in Iceland. It holds the ice frozen through on 18.9% of days, the highest share of any month, and it thaws and refreezes less often than December or January.
-
January is a close second, and the month to pick if you want the cave to yourself. It is frozen through on 18.8% of days too, but it thaws and refreezes more often, 6.7 times a month against 5.7 in February.
-
March scores well, but on softer ice. It is the driest month of the season and its rivers are at their annual low, yet it is frozen through on only 10.7% of days.
-
October is the weakest month of the season. The glacier is still draining at 101% of its annual average flow, and October has the most heavy-rain days of any month tours run.
-
Rain on the day matters more than the month. On days with 0.8 inches (20 mm) of rain or more, cancellations rise from 13.2% to 20.4% on the crystal cave tours and from 9.0% to 14.0% at Katla.
-
Counting ice cave tour cancellations by month is misleading. Months with more bookings have more cancellations. Measured as a rate, the monthly differences almost disappear.
Cite This Study
The charts and data in this study are free to use under CC BY 4.0. Credit Guide to Iceland and link to this page. Every chart has an Embed button underneath it with ready-to-paste code.
Overview: What Makes an Ice Cave Dangerous
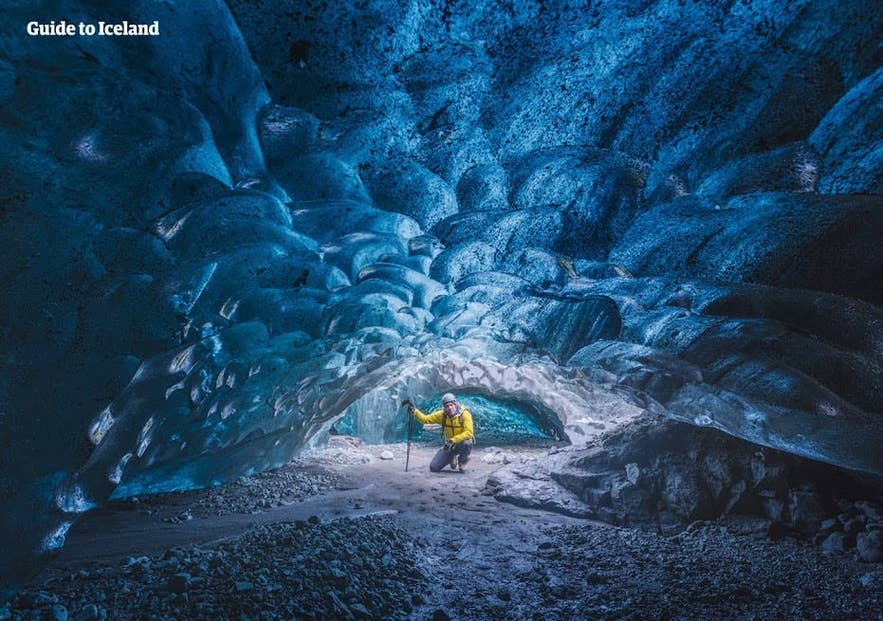 An ice cave is not built but dissolved. Meltwater cuts a channel through the glacier in summer, and the water drains away in fall. What is left is a hollow you can walk into.
The same water that makes the ice cave is the thing that brings its roof down.
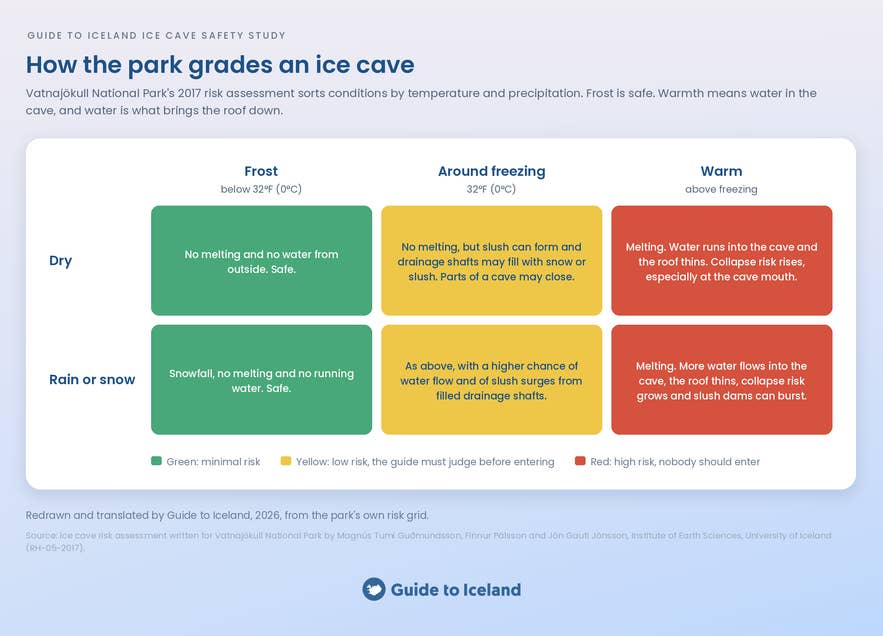
Vatnajokull National Park's 2017 risk assessment grades ice cave conditions on exactly this. It was written for the park by the University of Iceland glaciologists Magnús Tumi Guðmundsson and Finnur Pálsson with the mountain guide Jón Gauti Jónsson, and it sorts a cave into one of three colors.
-
Green means frost and no melting: snow on the ground or temperatures below freezing, with no water running into the cave.
-
Yellow means conditions near freezing, where slush can form and parts of a cave may be closed.
-
Red means warm weather and water: melting, water flowing into the cave, a thinning roof, and a rising risk of collapse. On red, nobody goes in.
Warm weather can undo an ice cave fast. In August 2024, an ice wall collapsed on Breidamerkurjokull and killed a visitor, and the rules that followed are covered later in this article. In a Reykjavík Grapevine interview after the collapse, Magnús Tumi said the walls and roof of an ice cave can thin by 4 inches (10 cm) in a single day.
So the question of which month is safest for an ice cave comes down to three measurable things:
-
How much of the month the ice stays frozen solid.
-
How often it thaws and refreezes, which is what opens cracks in the roof.
-
How much water is moving through the glacier.
Study Method and Data Collection: How We Scored Each Month for Ice Stability
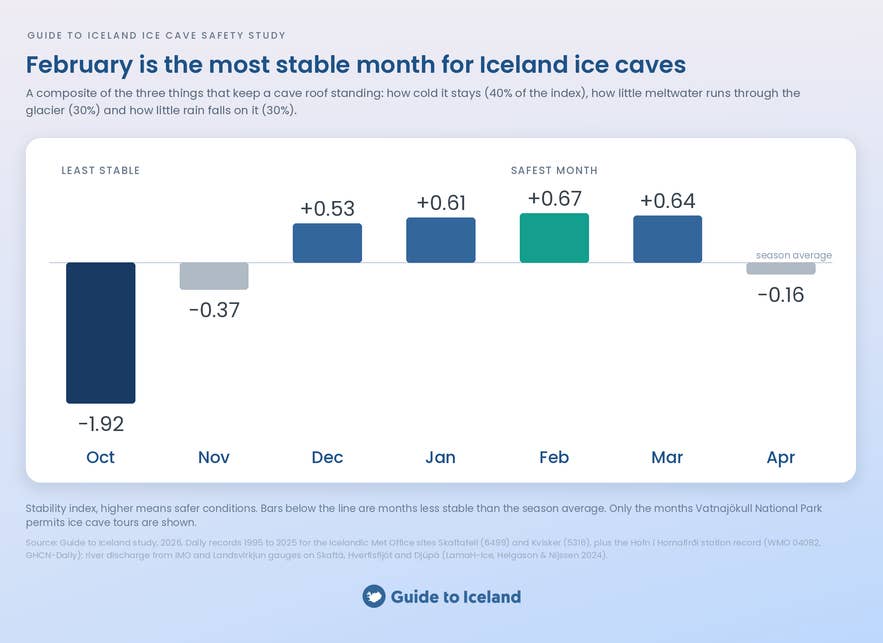
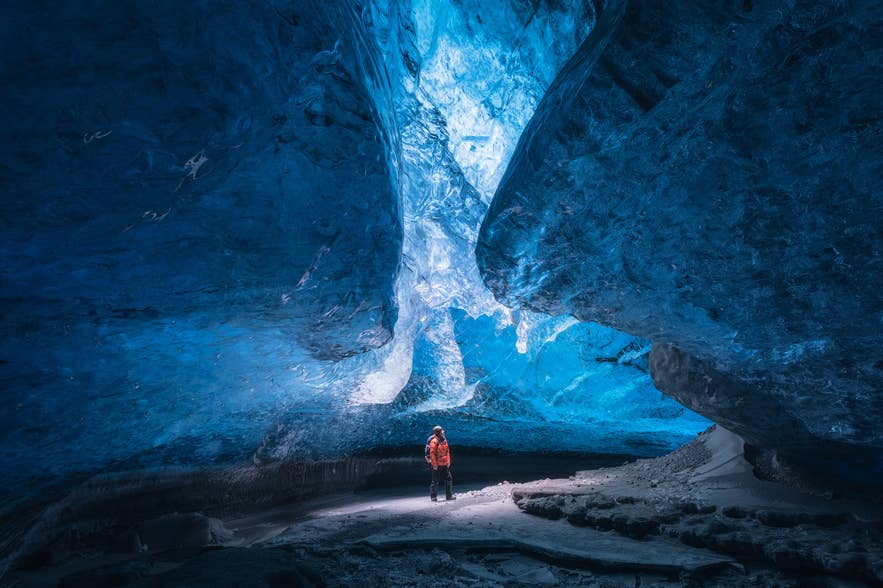 We scored every month of the ice cave season on three things: how cold it is, how much meltwater is moving through the glacier, and how much rain falls. Cold counts for 40% of the score, meltwater for 30%, and rain for 30%.
The cold and rain figures come from 31 years of daily weather records, from 1995 to 2025, at three sites in the southeast: the Icelandic Met Office stations at Skaftafell and Kvisker, plus the long-running station at Hofn i Hornafirdi.
The meltwater figures come from the flow gauges on three glacial rivers draining Vatnajokull: the Skafta, Hverfisfljot, and Djupa.
Beyond the monthly scores, we looked at 17,779 real ice cave bookings on two glaciers to see when tours actually get canceled, and at the rules Vatnajokull National Park set after the 2024 collapse. The full method, sources, and definitions are at the end of this article.
The table below shows each month's score and the measures behind it. The meltwater column compares each month's river flow with the river's year-round average. That average is set at 100%, so February's 36% means the rivers carry about a third of their usual water. In August, at the height of the melt, the figure is 264%, more than two and a half times the average.
| Month | Stability score | Days frozen through | Freeze-thaw cycles a month | Warm rain days | Heavy rain days | Meltwater |
|---|---|---|---|---|---|---|
| October | -1.92 | 1.0% | 1.9 | 33.0% | 12.1% | 101% |
| November | -0.37 | 9.9% | 4.8 | 28.4% | 8.7% | 57% |
| December | +0.53 | 18.5% | 6.5 | 23.8% | 7.7% | 44% |
| January | +0.61 | 18.8% | 6.7 | 25.9% | 6.6% | 37% |
| February | +0.67 | 18.9% | 5.7 | 25.0% | 7.2% | 36% |
| March | +0.64 | 10.7% | 5.2 | 21.0% | 5.1% | 32% |
| April | -0.16 | 1.9% | 2.9 | 22.3% | 6.4% | 40% |
A positive stability score means the ice in that month is more stable than the season's average, and a negative score means it is less stable.
February has the most stable ice, and the top three months are within 0.06 of each other. Outside the four winter months, the scores drop sharply. April, November, and October all score below zero. October, the month the park reopens, has the least stable ice of the season.
February Keeps Glacier Ice Frozen More Often Than Any Other Month
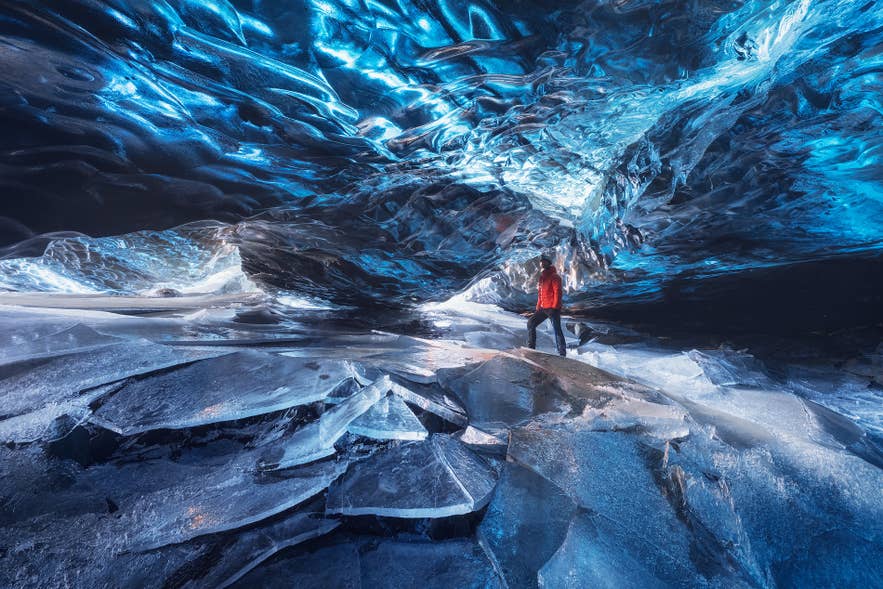 On the ice stability score, the four winter months are close. February, March, and January sit within 0.06 of each other, and that gap is smaller than the normal swing in conditions from one winter to the next.
How much a month varies from one winter to the next is the problem. February's own share of cold, dry days has ranged from 0% to 64% across the 31 winters we looked at, so the scores alone cannot separate February, March, and January. What separates them is the measure the park's risk assessment puts first: cold ice with no water in it.
On frozen-through days, February and January lead together. Across the three sites, 18.9% of February days and 18.8% of January days never rise above freezing, the highest shares of any month.
February then edges January because it thaws and refreezes less often: 5.7 times in an average month, against 6.7 in January and 6.5 in December. Each thaw and refreeze expands and contracts the ice, so fewer of them mean a more rigid roof.
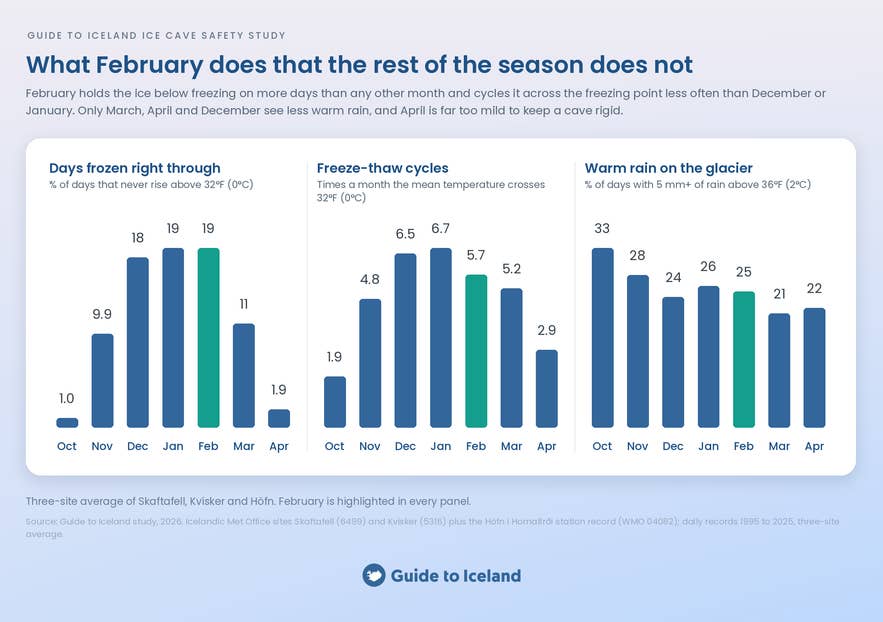
March also scores well on ice stability, but for different reasons. It is the driest month of the season, its glacial rivers are at their annual low, and it thaws and refreezes only 5.2 times a month, less often than December, January, or February. March is also much warmer. It holds the ice below freezing on only 10.7% of days, barely half of February's share.
March is a good month with one real weakness. February does not have one.
Rain tells the same story, with February near the dry end and October at the wet end. Warm rain, meaning 0.2 inches (5 mm) or more on a day above 36°F (2°C), falls on 25% of February days, against 33% in October and 28% in November. Only March, April, and December see less.
April is far too mild to keep an ice cave rigid. It holds the ice below freezing on 1.9% of days.
Glacial Meltwater Is Lowest in February and March
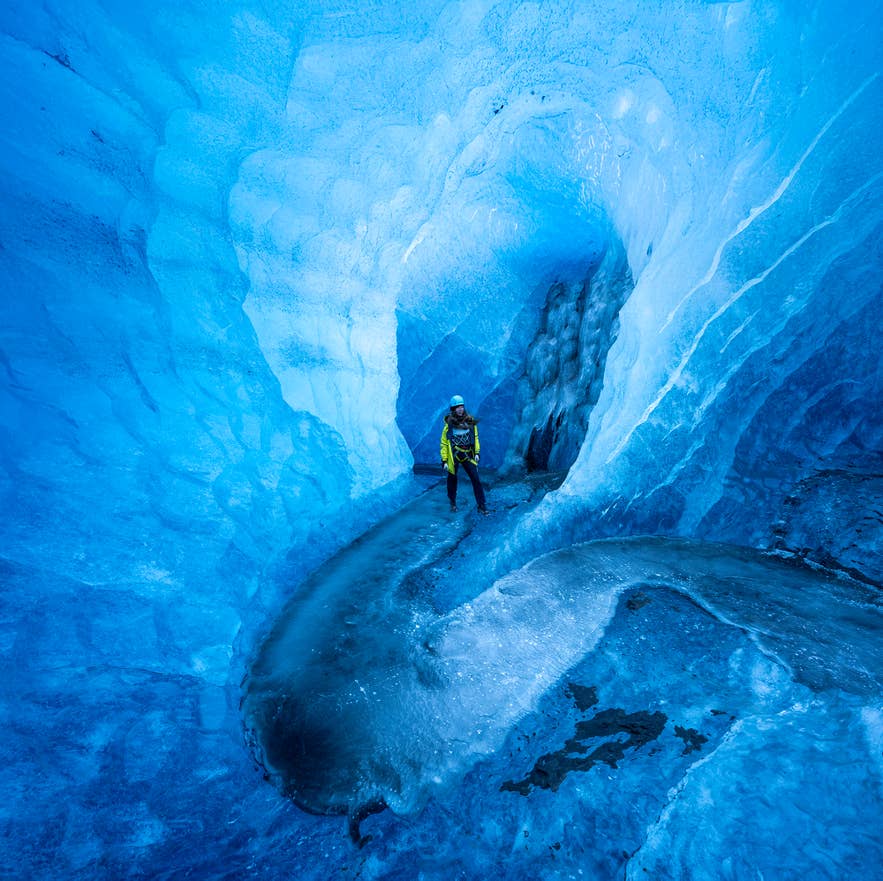 Of the three measures in this study, meltwater is the clearest sign of whether an ice cave is safe. Water moving through the glacier is what carves a cave and what brings its roof down, and the rivers flowing out of the glacier show how much of it there is. In late winter, that flow drops to its lowest point of the year.
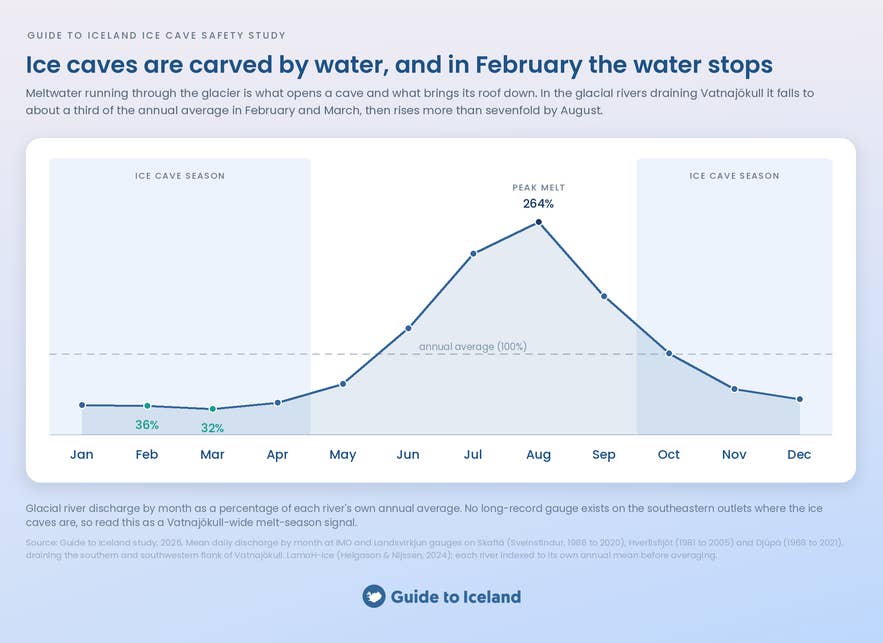
In the glacial rivers draining Vatnajokull, February flow falls to 36% of the annual average and March to 32%. By August it is at 264%, more than seven times the February figure.
October, the month Vatnajokull National Park permits ice cave tours to resume, is still running at 101% of the annual average. In plain terms, the glacier is still actively draining when the first tours of the season go in.
This is the physical reason ice cave tours originally ran only from November to March, a cautious four to five months. Einar R. Sigurðsson, the only guide consistently running winter tours on Vatnajokull between 1994 and 2012, stopped around March 20 each year because the sun was getting higher and warmer. The season has since stretched later, and in places into summer.
Rain on the Day Predicts Ice Cave Tour Cancellations Better Than the Month
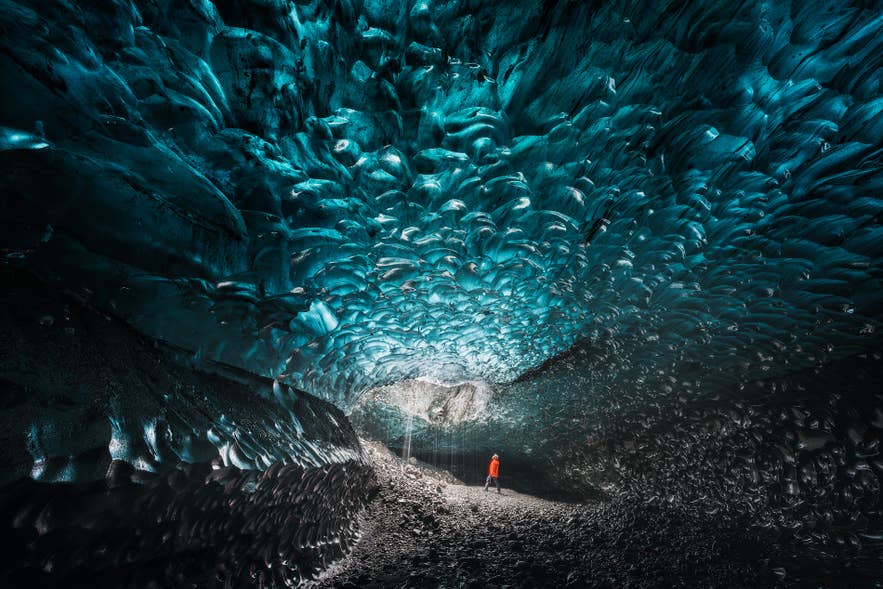 Tour cancellation figures are easy to misread, and most articles about the safest month to visit ice caves in Iceland misread them.
The Katla ice cave tour at Myrdalsjokull Glacier runs all year, which makes it the best test we have. We looked at 7,528 of its departures, leaving out the pandemic years of 2020 and 2021. September had more canceled tours than any other month. It also sold more tours than any other month.
That is the trap in counting cancellations. A month with twice the bookings will have roughly twice the cancellations, even if the ice is no worse. Rank the months by how many tours were canceled and you get almost the same list as ranking them by how many were sold (a correlation of 0.84, where 1.0 would be a perfect match).
The fair measure is the cancellation rate: out of every 100 bookings in a month, how many were canceled. Measured that way, the link to popularity disappears (the correlation drops to -0.08, close to zero).
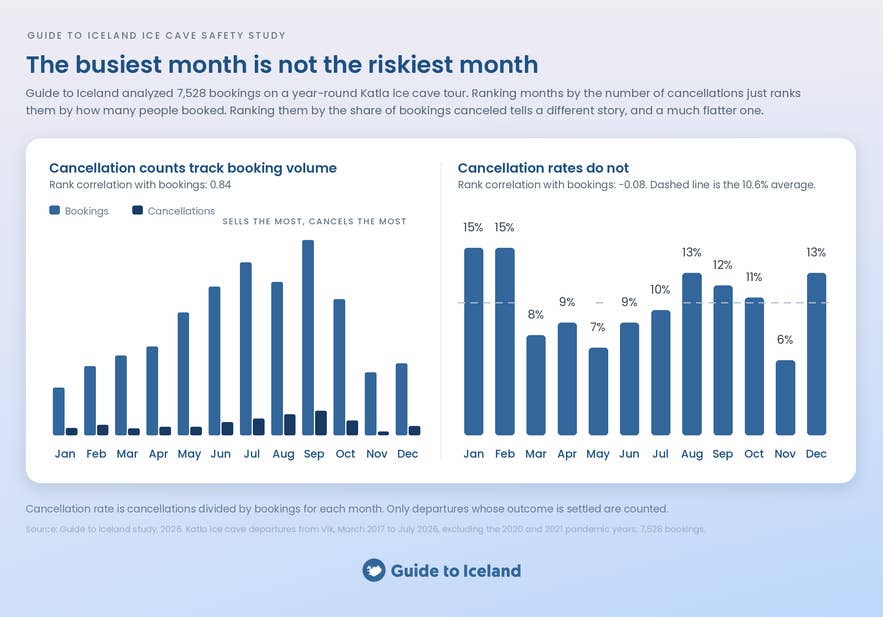
Once you use cancellation rates, the differences between months turn out to be small, and they do not line up with how stable the ice is.
February 2026 was the fifth-coldest February at Kvisker since 1995 by daytime highs, with 8 days that never rose above freezing against a usual 4.4, and it was drier than normal. By every measure in this study, it should have been a safe month. It still had the second-highest cancellation rate of that winter.
Ice cave tours get canceled for many reasons besides ice: staff shortages, closed roads, too few people to run a departure, and travelers changing their plans.
The weather on the day itself is a different story.
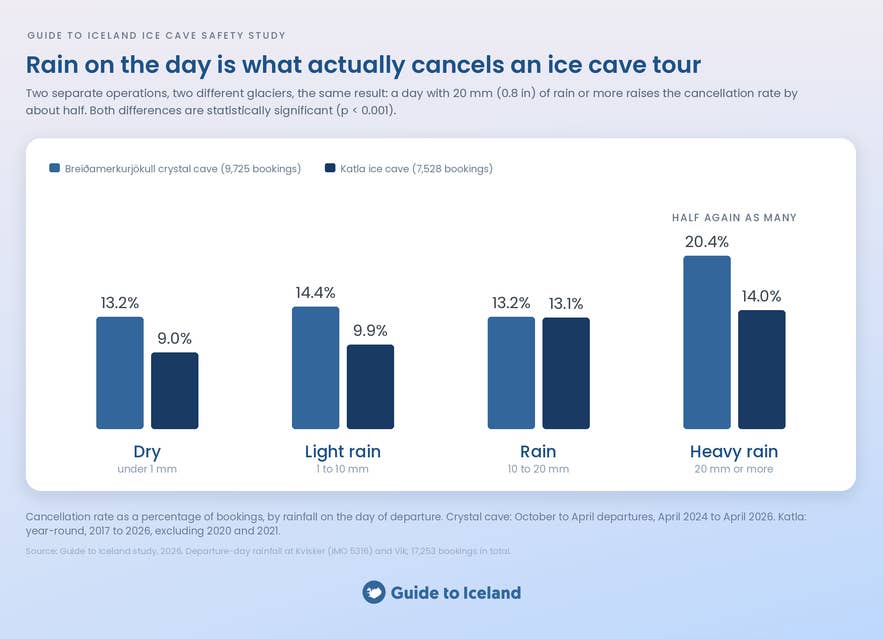
On days with 0.8 inches (20 mm) of rain or more, 20.4% of crystal cave tours on Breidamerkurjokull Glacier were canceled, against 13.2% on dry days. On the Katla tour, it was 14.0% against 9.0%. Two different operations on two different glaciers were both about 50% more likely to cancel in heavy rain. Lighter rain makes little difference; the jump comes at 0.8 inches (20 mm) and above.
With this many departures, a pattern that strong is not chance. The odds of it appearing by luck are less than one in a thousand.
October has the most heavy-rain days of any month in the season, 12.1% of its days. That is one more reason the start of the season is the riskiest part of it.
Ice Cave Tours in Vatnajokull Now Run October to April by Rule
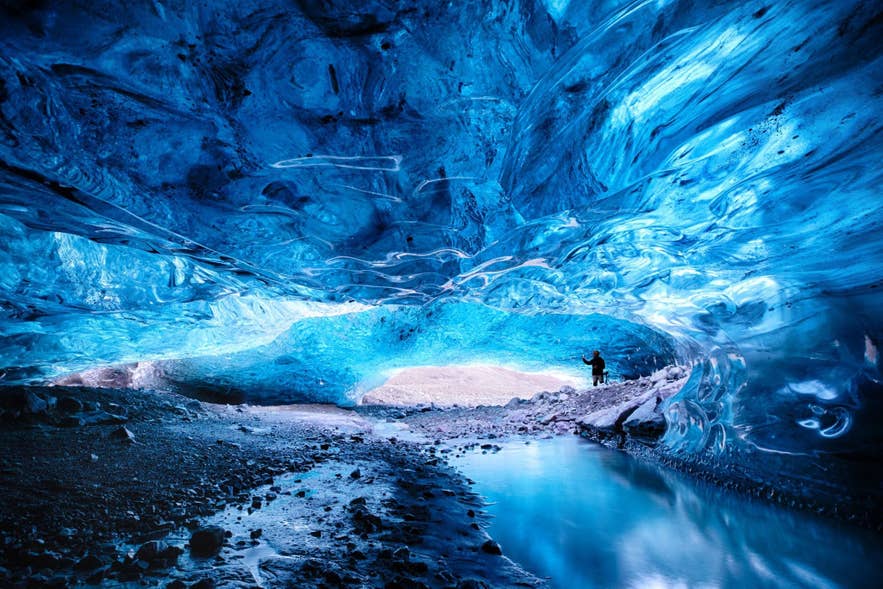 Nobody runs a Breidamerkurjokull ice cave tour in September anymore, and that is not an operator preference. On August 25, 2024, an ice wall collapsed at Breidamerkurjokull, killing an American visitor and seriously injuring another. Vatnajokull National Park suspended ice cave tours inside the park, and the rules that came out of it are the strictest in the country.
Ice cave tours inside Vatnajokull National Park run October to April and are closed May through September. Operators appoint experienced lead guides who assess every cave and every overhanging feature daily. If a site is judged unsafe, nobody goes there that day.
An expert council oversees the daily cave assessments, drawn from the operators themselves, the park, the Icelandic Travel Industry Association, the East-Skaftafell Tourism Association, and the Association of Icelandic Mountain Guides, and funded by a fee the companies pay per customer. Thirty-four companies applied for the 30 contracts available in the current two-year round, which started in November 2024.
The park's rules stop at its boundary. Kotlujokull, where the Katla ice cave sits above Vik, is outside it, and ice cave tours there are not governed by the same framework.
Dagbjartur Brynjarsson, safety specialist at the Icelandic Tourist Board and chair of the government's working group on tourist safety, put it plainly in an April 2025 interview with RÚV: "In reality, there are no established rules on how ice cave tours should be conducted in Iceland."
January Is the Month if You Want an Ice Cave to Yourself
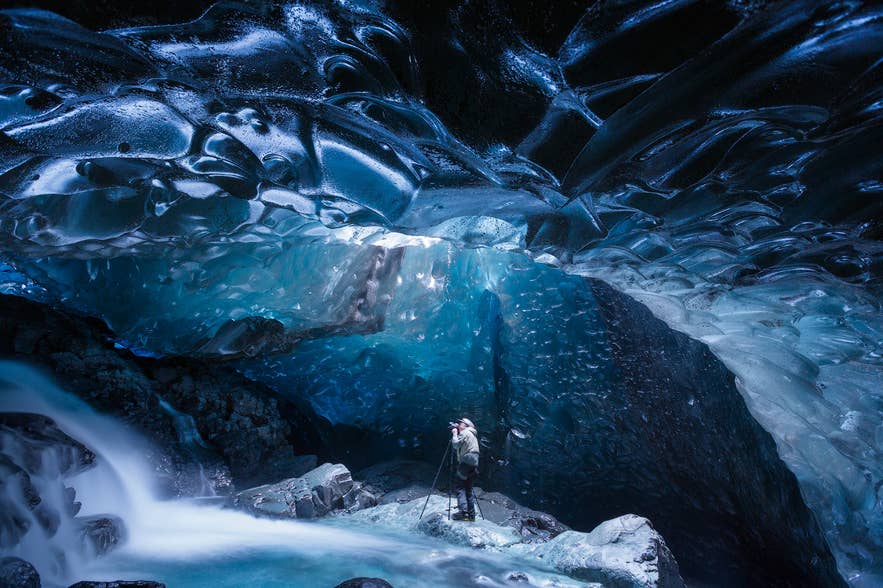 If ice conditions are all you care about, February is the safest month to visit an ice cave in Iceland. If you also care about crowds, January is the answer.
Our ice cave timing study counted who actually walked into the cave each day. January was the quietest month of the season, with 34 travelers a day against 85 in October, and Saturday was the quietest day of the week.
What do you give up on ice safety by choosing January over February? Very little.
January is frozen through on 18.8% of its days and February on 18.9%, so on the measure the park trusts most, the two months are level.
January's one weakness is that it thaws and refreezes more often, 6.7 times a month against 5.7 in February. That small difference is all that separates their scores, +0.61 against +0.67, and the gap is smaller than the swing from one winter to the next.
October is the opposite trade for ice cave visitors. It is the busiest month of the season and the weakest month for ice: the least cold, the most rain, and the most meltwater.
What This Ice Cave Safety Study Does Not Tell You
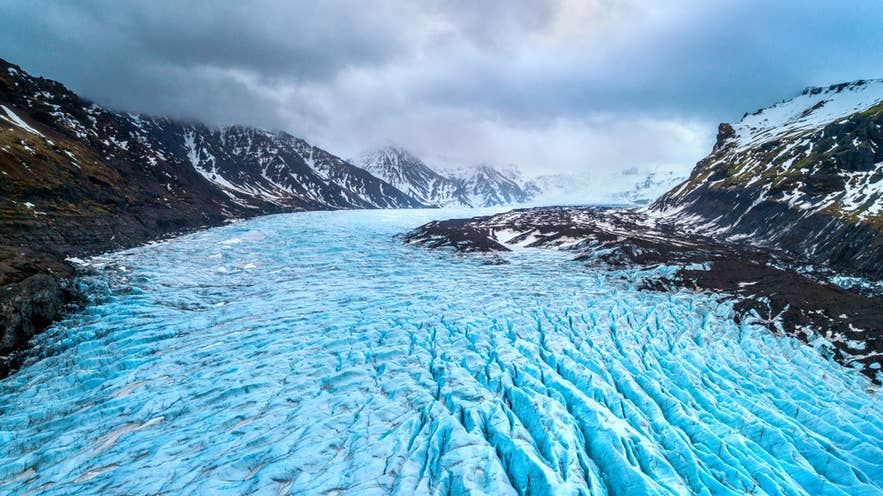 This study ranks the months of Iceland's ice cave season by how stable the ice is likely to be, using weather records, river flow, and our own bookings. Here is what it can and cannot support.
-
This study describes Southeast Iceland, not the whole country. The weather and meltwater figures come from the area around Vatnajokull, where the crystal ice caves are. The Katla ice cave is on a different glacier, Myrdalsjokull, well to the west and outside the park's rules. Our booking figures include Katla, but our weather and meltwater figures do not describe it.
-
Two of the three weather records are estimates, not measurements. Only Hofn has a directly measured record. The Skaftafell and Kvisker figures are reconstructed from a global weather model and corrected against Hofn. They are good estimates, not thermometer readings.
-
The river-flow records end between 2005 and 2021. Iceland is warmer now than it was for most of those years. Our weather study puts the country about 1.8°F (1°C) warmer than in the 1960s to 1980s. The rivers still run lowest in late winter and highest in August, and that pattern has not changed. The exact percentages may have. The gauges also sit on rivers to the south and southwest of Vatnajokull, not the southeast where the caves are, because no long river record exists there.
-
The stability score does not include wind. The thing that most often stops an ice cave tour is not the cave but the road, and south coast roads close in storms. Our weather study finds February is the windiest month of the Icelandic year, averaging 14 mph (6.4 m/s), and December has the most storm days with a risk of road closures, 7.8. The safest month for the ice is not the calmest month for the drive.
-
The booking figures cover Guide to Iceland customers only. They do not count everyone who visited the caves. The pattern across months should hold for other operators, but the totals are ours alone.
-
No month guarantees an ice cave. Tours are canceled for staffing, road access, and group minimums as much as for ice, and the cave that is open on your date is decided by a guide that morning, not by a study.
Booking Your Ice Cave Tour
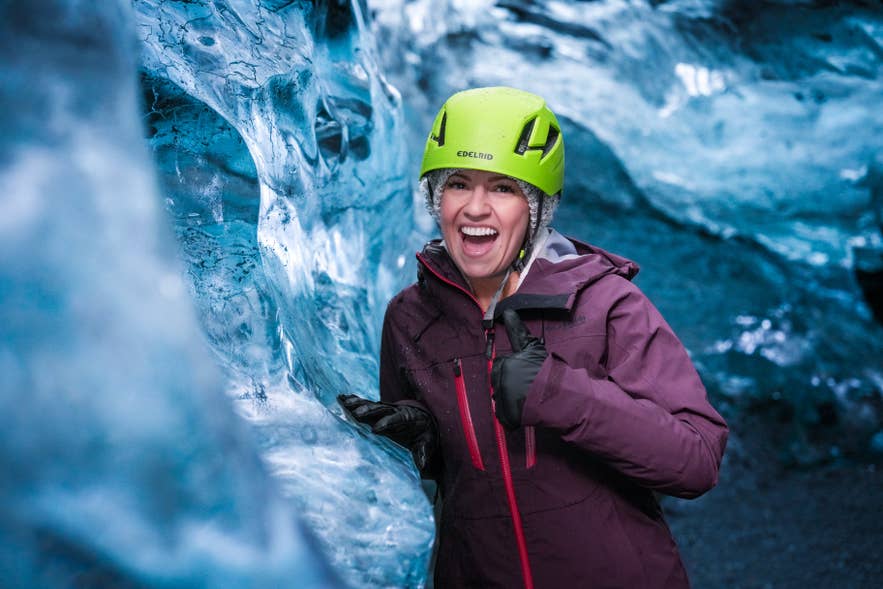
Most people cannot choose their month freely, so here is what this study means depending on when you can travel and what you want from the tour.
Trip length also matters when planning an ice cave tour. Our study on how many days you need in Iceland found that a longer itinerary gives you more flexibility to account for changing weather and adjust your plans if a tour is canceled or conditions change.
If your dates are flexible, book the Crystal Blue Ice Cave Tour in Vatnajokull Glacier from Jokulsarlon Glacier Lagoon for February, or January if you want the cave nearly to yourself. It is the tour most of the booking data above comes from, and it runs October to April inside the park's rules. For the day of the week and the departure time to choose, our companion study on when to visit ice caves in Iceland has the answer.
If your dates are fixed and fall within the October to April ice cave season, watch the forecast rather than the calendar. The month you land in matters less than whether it rains hard on the day, so check the weather for your departure date, leave a spare day in the itinerary, and book a departure early in your stay so a canceled tour can be rebooked. The hotels near Jokulsarlon make that far easier than driving out from Reykjavik.
If your dates fall outside the October to April season, the Katla Ice Cave Tour from Vik runs all year under Myrdalsjokull Glacier and is a much shorter drive from Reykjavik. Stay at one of the hotels in Vik and the meeting point is minutes away.
If you want ice underfoot as well as overhead, the Skaftafell ice caving and glacier hike combines the two, and the wider range of glacier hiking tours covers both ice caps.
Guide to Iceland works only with operators who hold a valid contract with Vatnajokull National Park and whose guides carry the required certification, so every tour we sell meets the highest safety standards in Iceland.
How We Built the Study on the Safest Month for Ice Caves
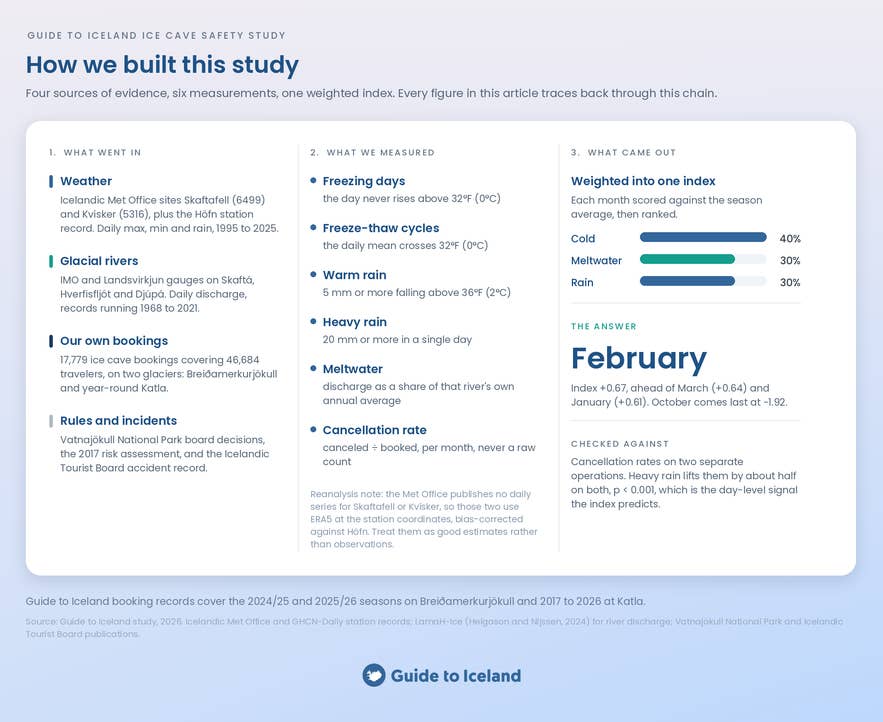
This study draws on four kinds of evidence: 31 years of weather records, the flow of three glacial rivers, Guide to Iceland's own booking records, and the rules Vatnajokull National Park set after the 2024 collapse.
1. Weather: How Cold and How Wet Each Month Is
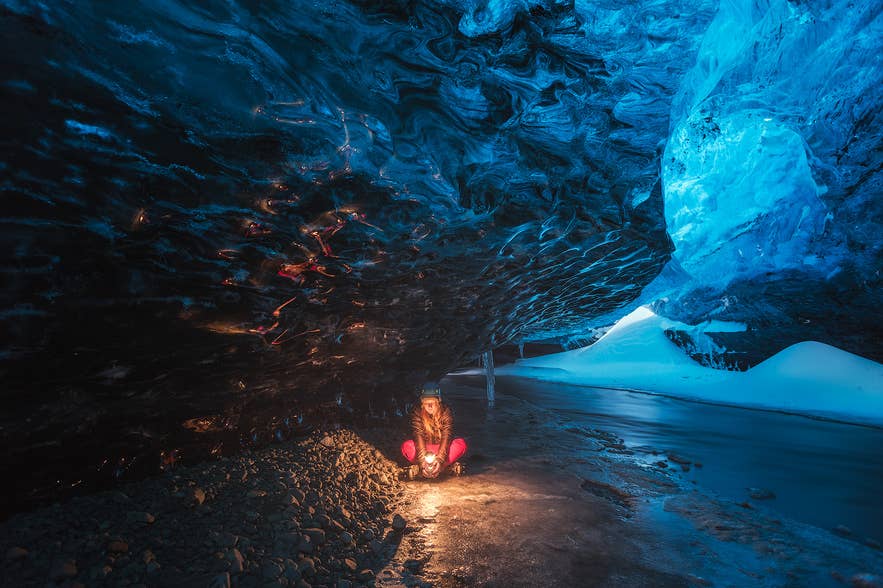
To measure cold and rain, we used daily high and low temperatures and rainfall from 1995 to 2025 at three places in southeast Iceland, near the ice caves. These are the Icelandic Met Office weather stations at Skaftafell and Kvisker, and the long-running station in the town of Hofn.
Only the Hofn record is made of direct thermometer readings. It comes from an international archive of station data, the Global Historical Climatology Network (station WMO 04082, 1973 to 2025).
The Icelandic Met Office does not publish daily figures for Skaftafell or Kvisker, so for those two we used ERA5, a global weather reconstruction that estimates past conditions at any point on Earth, at each station's exact location.
Reconstructions like ERA5 run slightly cold in Iceland, so we corrected the figures month by month against the real Hofn readings. The correction removed an average error of 3.4°F (1.9°C) in the daily highs and roughly halved the remaining error, from 4.3°F (2.4°C) to 2.7°F (1.5°C), across the 6,409 days where both records exist.
The reconstruction's ground height is within 20 feet (6 m) of the real station at both sites, so elevation does not distort the comparison. Even so, treat the Skaftafell and Kvisker figures as good estimates rather than measurements.
2. Definitions: What We Counted
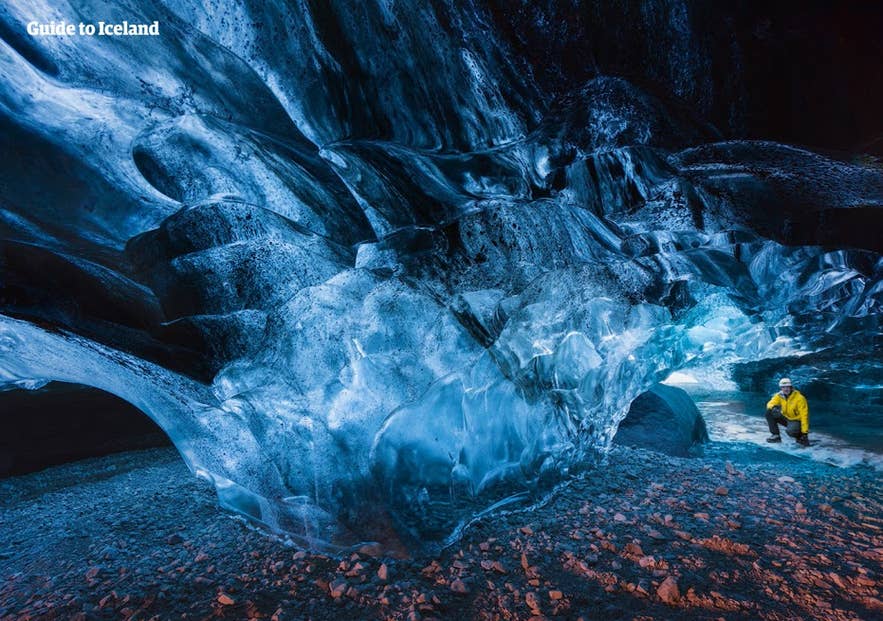 Every figure in this study uses the same five definitions:
-
A frozen day is a day whose high stays below 32°F (0°C).
-
A freeze-thaw cycle is each time the day's average temperature crosses 32°F (0°C) within a month.
-
Warm rain is 0.2 inches (5 mm) or more of rain on a day whose high is above 36°F (2°C), the conditions that send water into a cave.
-
Heavy rain is 0.8 inches (20 mm) or more in a day.
-
A dry day has less than 0.04 inches (1 mm).
3. Glacial River Flow: How Much Water Moves Through the Ice
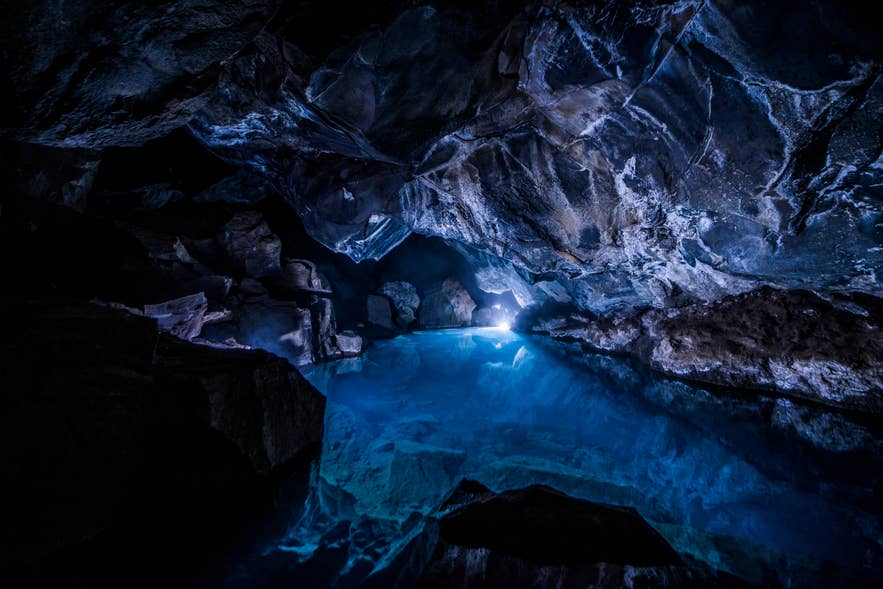
Glacial rivers carry meltwater out of the glacier, so their flow shows how much water is moving through the ice. We used average daily flow by month at three gauges run by the Icelandic Met Office and Landsvirkjun, the national power company. They are the Skafta at Sveinstindur (1986 to 2020), the Hverfisfljot (1981 to 2005), and the Djupa (1968 to 2021).
All three rivers drain the southern and southwestern side of Vatnajokull, and between 33% and 69% of each river's catchment is glacier. Each river's monthly flow is compared with its own annual average, and the three are then averaged. The data comes from the LamaH-Ice dataset (Helgason and Nijssen, Earth System Science Data, 2024).
No long river record exists right where the ice caves are. The river below Breidamerkurjokull, Jokulsa a Breidamerkursandi, is only about 1,640 feet (500 m) long, too short to gauge. The nearest long record, the Smyrlabjargaa in Sudursveit, drains a catchment that is only 4% glacier. So the meltwater curve describes Vatnajokull as a whole rather than Breidamerkurjokull in particular.
4. Bookings and Cancellations: When Tours Actually Ran
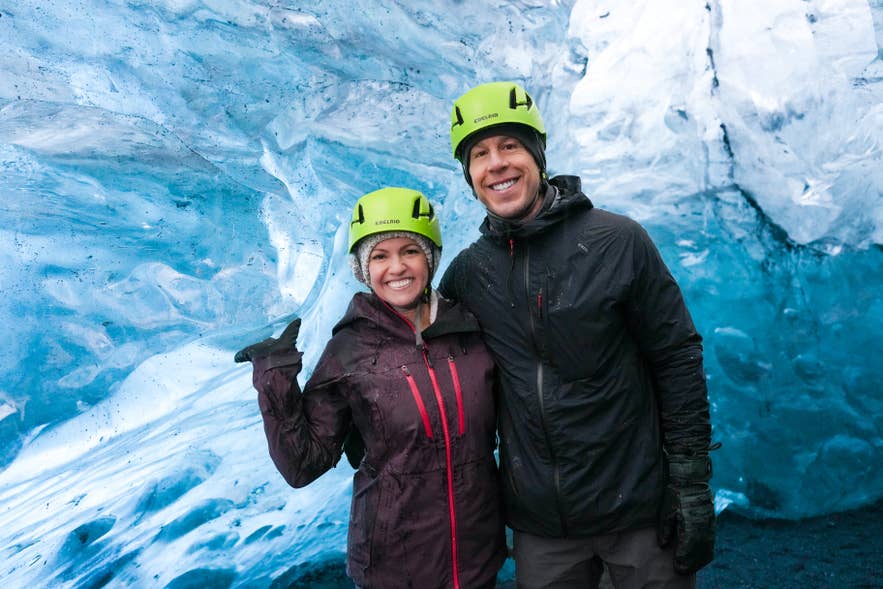
We used 17,779 ice cave bookings covering 46,684 travelers, all made through Guide to Iceland:
-
9,725 on the Breidamerkurjokull crystal cave tours from Jokulsarlon (October to April departures, April 2024 to April 2026)
-
8,054 on the year-round Katla ice cave tour from Vik (March 2017 to July 2026)
Three rules shaped the booking count. Breidamerkurjokull departures outside October to April are left out, because operators no longer run that glacier out of season. Only departures whose outcome is known, run or canceled, are counted, and canceled departures are included because the cancellation rate is one of the study's measures.
Our companion study on the best time of the year to visit ice caves in Iceland leaves them out, since a tour that did not run put nobody in the cave, and it covers only the two most recent seasons, which is why its traveler totals are lower. The pandemic years 2020 and 2021 are left out of the Katla monthly figures, which leaves 7,528 departures.
Cancellation rates are always given as a share of that month's bookings, never as a count, because a month with more bookings has more cancellations whatever the ice is doing.
5. Regulation and Incidents
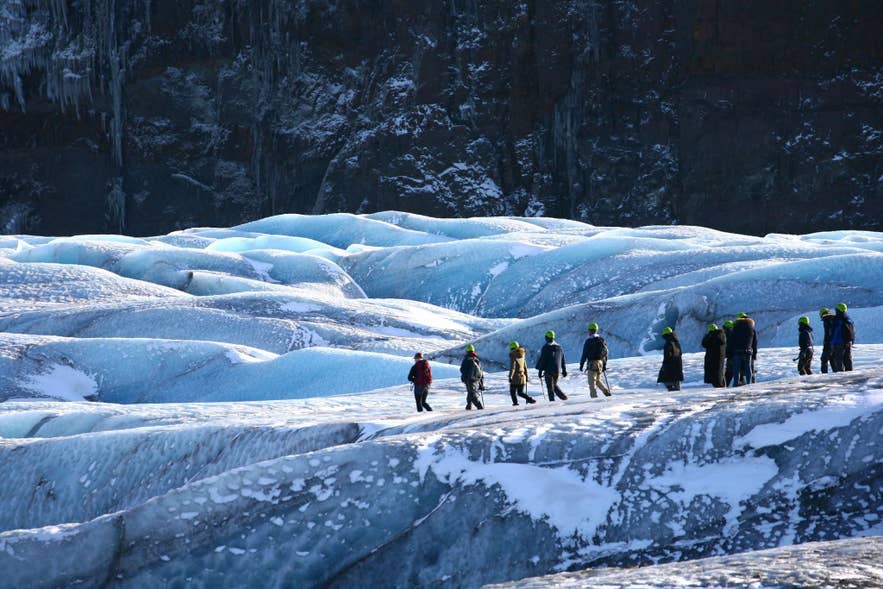 The account of the 2024 collapse and the rules that followed draws on Vatnajokull National Park board decisions and news releases, reporting by RÚV, Iceland Review, and the Reykjavík Grapevine, and the Icelandic Tourist Board's 2025 data on accidents in Icelandic nature.
6. Sources
- Guðmundsson, M. T., Pálsson, F., and Jónsson, J. G. (2017). Íshellar í Vatnajökulsþjóðgarði: Aðferðir við mat á áhættu. Institute of Earth Sciences, University of Iceland, report RH-05-2017.
- Global Historical Climatology Network daily, NOAA National Centers for Environmental Information. Station WMO 04082, Höfn í Hornafirði, 1973 to 2025.
- ERA5 hourly data on single levels, Copernicus Climate Change Service. Generated using Copernicus Climate Change Service information (2026); neither the European Commission nor ECMWF is responsible for any use of it.
- Helgason, H. B., and Nijssen, B. (2024). LamaH-Ice: LArge-SaMple DAta for Hydrology and Environmental Sciences for Iceland. Earth System Science Data, 16, 2741–2771. Dataset version 1.5 via HydroShare. Streamflow records are owned by the Icelandic Meteorological Office and Landsvirkjun and are used with attribution under their terms.
- Icelandic Meteorological Office, weather station and river gauge data.
- Landsvirkjun, river gauge data.
- Vatnajökull National Park (2024). Board decisions and news releases on ice cave tours and glacier hikes.
- Icelandic Tourist Board (2025). Hættuatvik og slys í íslenskri náttúru, incidents and accidents in Icelandic nature.
- RÚV. Ice cave collapses at Breiðamerkurjökull (August 25, 2024) and Engar reglur gilda um íshellaferðir utan Vatnajökulsþjóðgarðs (April 2, 2025).
- Reykjavík Grapevine (2024). Breaking Point: Fatal Ice Cave Accident Raises Big Questions for Tourism Safety.
- Iceland Review (2024, 2025). Reporting on the collapse and on regulation outside the park.
- Guide to Iceland booking records, April 2024 to April 2026 (Breiðamerkurjökull) and March 2017 to July 2026 (Katla).
Conclusion
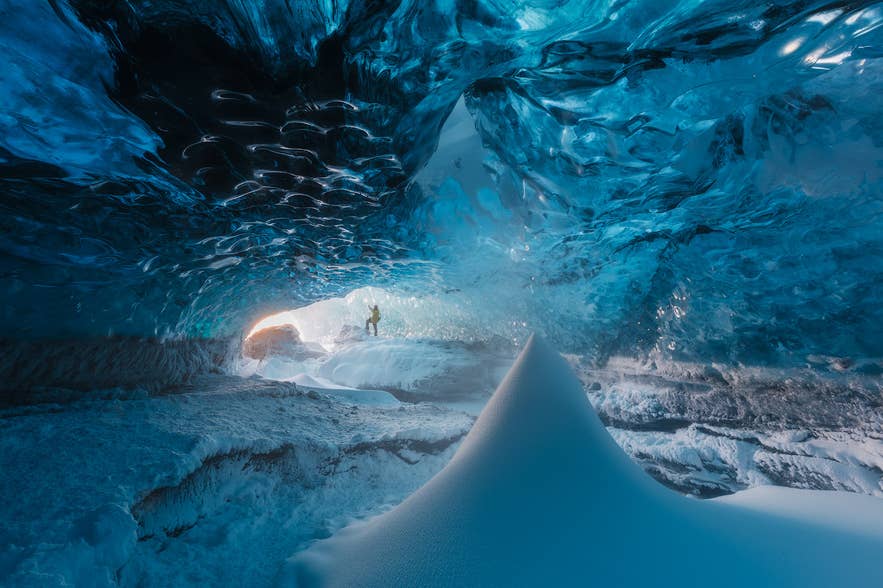 This study asked which month is safest for an ice cave in Iceland, and the answer is February. The ice has had a full winter to set, meltwater is at its quietest, and February thaws and refreezes less often than December or January.
January matches February on frozen days and runs it close overall. March is drier still, but it is frozen through on only half as many days. By April, the natural ice caves under Vatnajokull close for good reason.
For ice cave safety, the month matters less than the guide, though. Ice caves shift constantly, and a chamber that was solid last Tuesday can be off-limits today. The only real safety check is a certified guide who walked it that morning, which is why every ice cave tour in Iceland is guided.
Book the Crystal Blue Ice Cave tour early for January and February, since peak-season slots go weeks ahead. If your dates fall outside the natural cave season, the Katla ice cave tour runs year-round under Myrdalsjokull.
The practical lesson of this study is not to fear a month but to plan for a day. Most canceled tours are stopped by rain, wind, and closed roads rather than by the season, so build one spare day into your route through the south and check the weather forecast for your departure date.
February may be the safest month for the ice, but our weather study finds it is also the windiest. Read up on driving in Iceland in February before you commit to the drive from Reykjavik. If your tour runs, the ice has already been checked that morning by someone whose job is to say no.
Have you been inside an ice cave in Iceland? Which month did you go, and what did your guide say about the conditions that day? Tell us in the comments below.

Guide to Iceland Editorials is the shared byline for our content team. We use it on pieces several people worked on together, where no single writer owns the article, and on anything rewritten often enough that a personal byline would be misleading. We also publish our original data studies under this profile. Each study answers a question travelers ask about Iceland, using primary sources such as booking records, traveler reviews and public datasets, and every study is quality checked by human experts before it's published. Everything under this byline is researched and reviewed by people who live and work in Iceland. If you spot something out of date or want to suggest a correction, message us and it reaches the whole team.


