Most people planning an aurora trip assume that the best time to see the northern lights in Iceland comes down to the month first and the destination second. On instinct, they pick December, which sounds dark and therefore sounds correct. We wanted to know whether the geomagnetic record agrees.
The number every aurora forecast is built on is the Kp index. Kp runs from 0 to 9 and describes how disturbed Earth's magnetic field is over a three-hour window. Guides watch Kp when they decide which way to drive on northern lights tours and northern lights hotels use it to inform their guests on possible sightings for the night.
This study analyzes every Kp reading published since 1932. That comes to 276,584 values covering 95 years, from January 1, 1932 to August 27, 2026. The series is published by the GFZ Helmholtz Centre for Geosciences in Potsdam.
The GFZ series is the longest unbroken space-weather record in existence. It is also the only record long enough to answer a question about calendar months. We combined it with hours of darkness in Reykjavik, and with the cloud-cover figures from our analysis of Iceland's clearest skies.
Why You Can Trust Our Content
Guide to Iceland is the most trusted travel platform in Iceland, helping millions of visitors each year. All our content is written and reviewed by local experts who are deeply familiar with Iceland. You can count on us for accurate, up-to-date, and trustworthy travel advice.
Keep reading for the month-by-month ranking, the reason activity peaks twice a year, the months we recommend booking, and the limits of what this data can tell you.
Key Findings
-
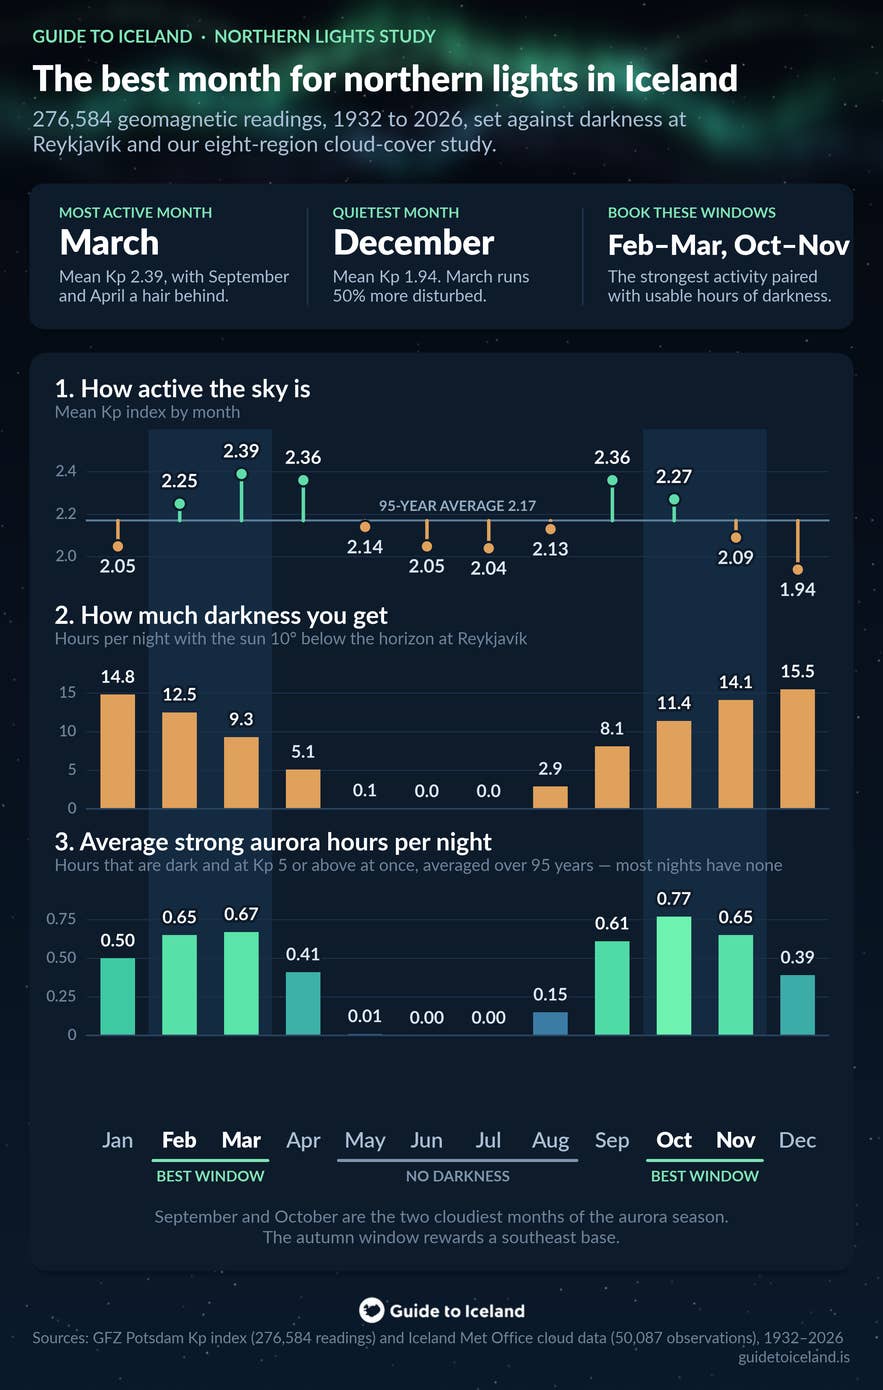
March is the most geomagnetically active month over Iceland. March averages a Kp index of 2.39 across 95 years, against a yearly average of 2.17. September and April tie for second place at 2.36.
-
December is the quietest month of the entire year. December averages a Kp index of 1.94, which is 50% less magnetic disturbance than March when both months are converted to the linear ap scale. December is also the darkest month in Iceland, which is why it gets recommended so often.
-
Severe geomagnetic storms are almost absent in December. September recorded 221 three-hour intervals at Kp 7 or above over 95 years and March recorded 214. December recorded 23. September and March together account for more than a quarter of every severe interval on record.
-
October delivers more active darkness than any other month. October averages 0.77 hours per night that are both dark and magnetically strong. December averages 0.39 hours, despite offering the longest nights of the year at 15.5 hours of darkness.
-
The clearest skies of the aurora season fall in November. Clouds cover about 72% of the sky in an average November. September and October are the two cloudiest months of the season, at about 75% each.
-
We recommend booking late February to late March, or October and November. March is the only month of the year that scores well on magnetic activity, hours of darkness, and clear sky at the same time. February sits just behind March on every measure.
-
April is the month to avoid if the aurora is the reason for the trip. April is magnetically active and has reasonably clear skies, but Reykjavik gets only 5.1 hours of usable darkness a night by mid-April. June and July in Iceland have no astronomical darkness at all.
-
A high Kp reading is not automatically good news in Iceland. Iceland sits at roughly 64 degrees corrected geomagnetic latitude, which places the country underneath the auroral oval. A Kp of 2 or 3 already puts the aurora directly overhead here.
-
The region you choose affects your odds more than the month you choose. Cloud cover varies by about 2 percentage points of sky between the months of the aurora season, and by about 15 percentage points between Icelandic regions. The southeast corridor between Kirkjubaejarklaustur and Djupivogur has the clearest skies in the country.
Cite This Article
Please link to this URL when referencing the findings or using the charts.
Overview: Study Method and Data Collection
 This study ranks every month of the year by how much northern lights activity Iceland actually receives. It then checks that ranking against the hours of darkness and the cloud cover a traveler would meet in the same month. The full detail is in the Method chapter at the end of the article.
-
Data collection: We downloaded the Kp_ap_since_1932 series published by the GFZ Helmholtz Centre for Geosciences, Geomagnetic Observatory Niemegk, on August 28, 2026. The series holds 276,584 three-hour Kp values from January 1, 1932 to August 27, 2026, with no missing intervals.
-
Data inclusion and estimation: We kept every interval. The final 216 intervals, covering August 2026, are flagged preliminary rather than definitive by the publisher, and we have marked them as such rather than excluding them.
-
Analysis: We computed monthly means across all intervals and again across night intervals only, defined as 21:00 to 03:00 UTC. We calculated the sun's elevation in Reykjavik every five minutes so that each three-hour interval carries a dark fraction rather than a yes or no flag.
-
Reporting: We report Kp values to two decimal places and hours to one. Where we describe a difference as a percentage, we use the linear ap index instead of Kp, because Kp is quasi-logarithmic and its differences cannot be read as ratios.
-
Validation: Every monthly figure was recomputed independently in a second programming language before publication, and both passes agree to three decimal places.
March Is the Most Geomagnetically Active Month Over Iceland
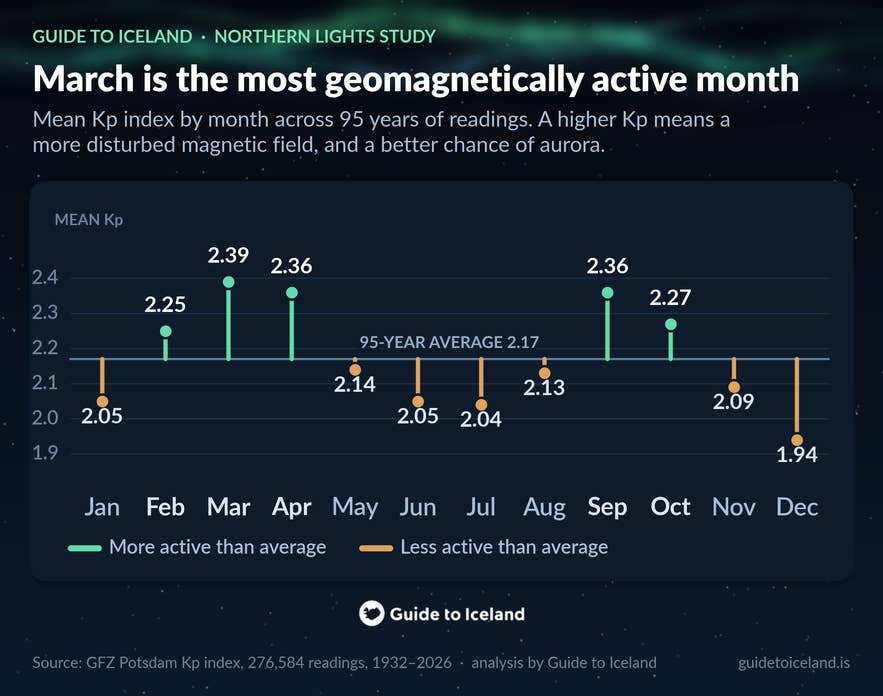 March is the most geomagnetically active month over Iceland, averaging a Kp index of 2.39 across 95 years of records. September and April tie for second place at 2.36, and February follows at 2.25. December is the quietest month of the whole year at 1.94, and the 95-year average across all months is 2.17.
Kp is a compressed scale, so the distance between 2.39 and 1.94 is larger than it appears. Converted to ap, the linear index that the GFZ publishes alongside Kp, March averages 31.8 nT of magnetic disturbance and December averages 21.2 nT. March runs 50% more disturbed than December, year in and year out.
March, April, and September sit clearly above every other month of the year. Their confidence intervals overlap one another, which means we can name the leading group but cannot rank the three months inside it. February and October form a distinct second tier at 2.25 and 2.27. Activity then falls away toward the solstice months in December and July.
April is the awkward result in that list. April ranks near the top for magnetic activity and is close to useless for actually seeing an aurora. Reykjavik receives only 5.1 hours of usable darkness a night across April. Magnetic activity is one of three requirements, and the other two are covered further down this article.
Northern Lights Activity Peaks Twice a Year Around the Equinoxes
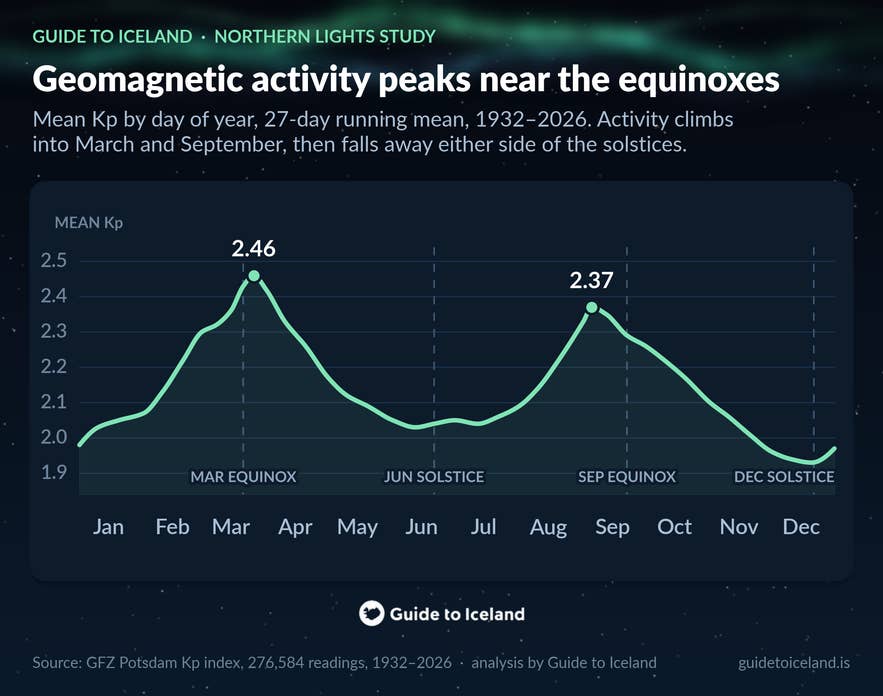 The two peaks in the chart above are not statistical noise, and they have nothing to do with Icelandic weather. They are a product of orbital geometry, and astronomers have been describing the pattern in magnetic records since 1856.
Energy crosses into Earth's magnetosphere when Earth's magnetic field and the sun's magnetic field point in opposite directions and reconnect. Near the equinoxes, the tilt of Earth against the interplanetary magnetic field makes that opposing component larger on average.
Reconnection therefore happens more readily around the equinoxes, and the Kp index runs higher. Physicists call this the Russell-McPherron effect, after the 1973 paper that set out the mechanism.
Russell-McPherron is not the only explanation in play. Cliver, Kamide, and Ling fitted three competing mechanisms to 130 years of magnetic data. They found that the equinoctial hypothesis carried the most weight, ahead of Russell-McPherron and the older axial hypothesis.
Lockwood and colleagues revisited the question in 2020 and declined to name a winner. Their conclusion was that the seasonal signal is a mixture of all three mechanisms.
The smoothed peaks lag the equinoxes by roughly five days, arriving near March 26 and September 24. The exact date shifts by up to a week depending on how the data is smoothed, so it is not worth quoting more precisely than that. The shape of the curve is what matters for a trip: activity stays elevated for about six weeks on either side of each equinox, which is a window wide enough to plan around.
Severe Geomagnetic Storms Are Almost Absent in December
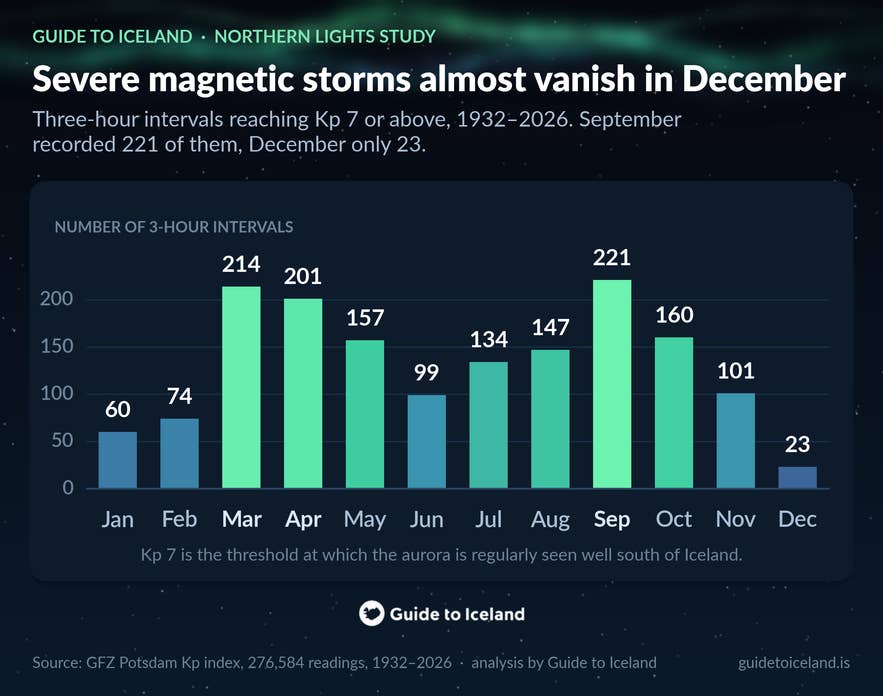 Monthly averages flatten out the thing travelers care about most, which is the rare night when the entire sky turns active. So we counted those nights directly, by tallying every three-hour interval in 95 years that reached a Kp of 7 or above.
September recorded 221 severe intervals and March recorded 214. December recorded 23. That is a 9.6-fold gap between the strongest and the weakest month of the aurora season, measured on exactly the displays that people cross an ocean to see. September and March between them account for 27% of every severe interval in the record, and December accounts for 1.4%.
| Month | Severe intervals | Share of all severe intervals |
|---|---|---|
| September | 221 | 13.9% |
| March | 214 | 13.4% |
| April | 201 | 12.6% |
| October | 160 | 10.1% |
| May | 157 | 9.9% |
| August | 147 | 9.2% |
| July | 134 | 8.4% |
| November | 101 | 6.3% |
| June | 99 | 6.2% |
| February | 74 | 4.7% |
| January | 60 | 3.8% |
| December | 23 | 1.4% |
Table 1. Three-hour intervals reaching a Kp index of 7 or above, by month, 1932 to 2026.
One caveat belongs with that table. Eleven of the 13 observatories that produce the Kp index sit in the northern hemisphere. Some part of the December shortfall may therefore reflect winter conditions at the measuring stations rather than a genuinely quieter magnetosphere. The pattern itself is solid across the record. The cause of the pattern is still argued over in the literature.
October Delivers the Most Active Hours of Darkness
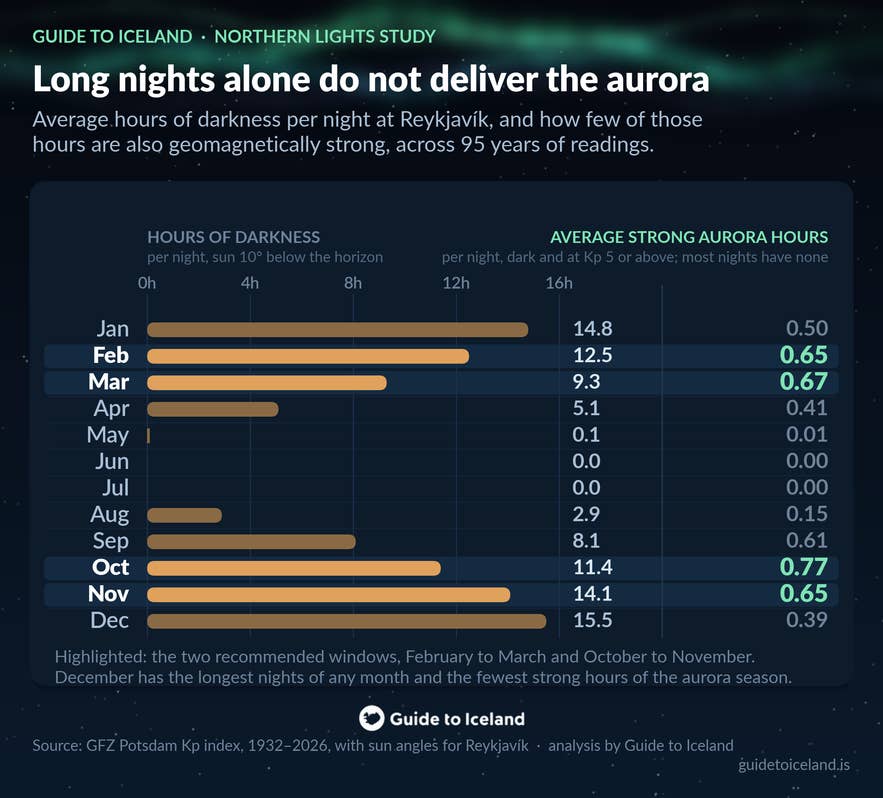 A Kp reading on its own cannot tell you when to visit, because seeing an aurora requires a dark sky as well as an active one. In Iceland those two conditions peak at opposite ends of the season. So we combined them. For every one of the 276,584 readings we computed the sun's elevation at Reykjavik. We then kept the portion of each interval during which the sun sat at least 10 degrees below the horizon.
December offers 15.5 hours of usable darkness a night, more than any other month, and November offers 14.1 hours. December converts only 0.39 of those hours into a Kp of 5 or above. October converts 0.77 hours out of 11.4 hours of darkness, which is twice December's figure. March manages 0.67 hours out of 9.3, February 0.65 out of 12.5, November 0.65 out of 14.1, and September 0.61 out of 8.1.
| Month | Mean Kp | Dark hours per night | Hours per night at Kp 5 or above | Average cloud cover |
|---|---|---|---|---|
| January | 2.05 | 14.8 | 0.50 | 74% of the sky (5.90 oktas) |
| February | 2.25 | 12.5 | 0.65 | 73% of the sky (5.83 oktas) |
| March | 2.39 | 9.3 | 0.67 | 73% of the sky (5.83 oktas) |
| April | 2.36 | 5.1 | 0.41 | 73% of the sky (5.80 oktas) |
| May | 2.14 | 0.1 | 0.01 | Outside the aurora season |
| June | 2.05 | 0.0 | 0.00 | Outside the aurora season |
| July | 2.04 | 0.0 | 0.00 | Outside the aurora season |
| August | 2.13 | 2.9 | 0.15 | Outside the aurora season |
| September | 2.36 | 8.1 | 0.61 | 75% of the sky (5.96 oktas) |
| October | 2.27 | 11.4 | 0.77 | 75% of the sky (5.97 oktas) |
| November | 2.09 | 14.1 | 0.65 | 72% of the sky (5.79 oktas) |
| December | 1.94 | 15.5 | 0.39 | 73% of the sky (5.81 oktas) |
Table 2. Magnetic activity, darkness, and cloud cover for every month of the year. Dark hours are hours per night with the sun at least 10 degrees below the horizon at Reykjavik. Cloud figures cover the aurora season only.
June and July have no astronomical darkness whatsoever, so no amount of magnetic activity is visible from Iceland in those two months. Travelers who come in June or July are trading the aurora for the midnight sun in Iceland, which is a fair trade but should be a conscious one.
Table 2 has a short practical reading. The deep-winter months give a traveler more hours to wait outside. The equinox months give a traveler more reason to be outside during those hours.
Cloud Cover Works Against September and October
 There is a third requirement for seeing an aurora, and the Kp index says nothing about it. Cloud cover is the condition that decides most Icelandic nights, so we measured it in a separate study.
Our analysis of Best Places in Iceland to See the Northern Lights: A Study of 89 Years of Cloud Coverage examined 50,087 monthly cloud observations. Those observations come from 144 Icelandic weather stations and go back to 1937.
The cloud record complicates the Kp ranking. September and October are both strong months on magnetic activity, and they are also the two cloudiest months of the aurora season. Clouds cover about 75% of the sky in an average September and an average October. November has the clearest skies of the season, at about 72% of the sky, and January is the third-cloudiest month at about 74%.
Before rewriting a trip around those figures, look at the size of the effect. Cloud cover varies by about 2 percentage points of sky across the months of the aurora season. It varies by about 15 percentage points across Icelandic regions, which is more than six times as much. Djupivogur in its cloudiest month is still clearer than Akureyri in its clearest month.
Moving a trip to a clearer month improves the odds of a usable sky slightly. Moving a trip to a clearer region, such as the southeast corridor between Kirkjubaejarklaustur and Djupivogur, improves them substantially. Both moves are worth making, and the regional one is worth making first.
The Equinox Pattern Holds Across Nine Solar Cycles
 A seasonal pattern in space weather is easy to produce by accident. Solar cycles run for roughly 11 years and vary enormously in strength, from a mean Kp of 2.50 in cycle 21 down to 1.57 in cycle 24. One strong March inside one strong cycle can drag a 95-year average a long way.
To test for that, we cut the record into its nine solar cycles and ranked the twelve months inside each cycle separately. March lands in the top three months in eight of the nine cycles. September also lands in the top three in eight of the nine. April manages seven. December is the weakest month of its own cycle in seven of the nine, and December never once reaches the top three.
That is about as stable as a seasonal signal gets in this field. It also means the finding is not an artifact of the current solar cycle and will not expire when the current cycle ends.
What the Kp Data Does Not Tell You
 Kp is a planetary index, not an Iceland measurement. The index is built from 13 subauroral observatories sitting between 44 and 60 degrees geomagnetic latitude, weighted toward Europe and North America. Kp describes the state of the global magnetosphere, and Iceland's own sky can differ from that global figure on any given night.
Kp says nothing at all about cloud, which is the binding constraint on most Icelandic nights. That is the reason we measured cloud separately, and the reason the cloud study ranks places rather than months.
Averages describe a season and not a night. A disappointing March and a spectacular December both happen every few years, and no amount of historical data changes what happens during the specific week a traveler books. The findings in this article improve the odds. They do not remove the gamble.
Finally, a high Kp reading is not automatically good news at Iceland's latitude. Iceland sits at roughly 64 degrees corrected geomagnetic latitude, which places the country underneath the auroral oval rather than south of it. At a Kp of 2 or 3 the aurora is already overhead in Iceland.
At a Kp of 5 and above the auroral oval expands southward. That expansion can leave Iceland on the poleward edge of the oval, with the display sitting to the south instead of arcing overhead. Chasing the highest possible Kp number is a mid-latitude strategy that does not transfer to Iceland.
The Best Months to See the Northern Lights in Iceland
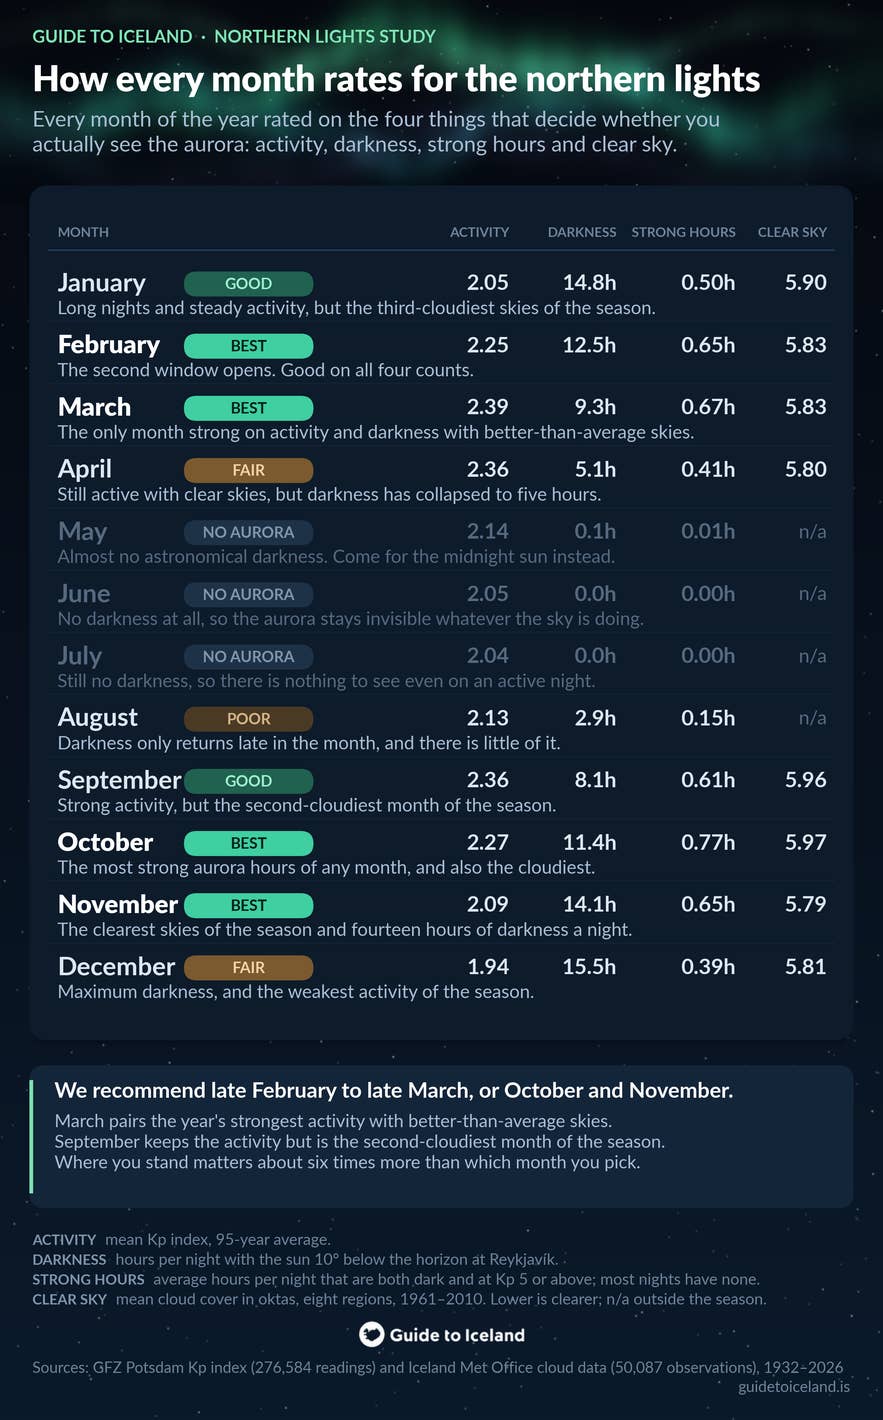
We recommend late February to late March, or October and November. Iceland in March is the only month of the year that scores well on all three requirements at once. March sits in the leading group for magnetic activity, still offers 9.3 hours of darkness a night, and has skies clearer than the seasonal average. Iceland in February sits just behind March on every count.
Iceland in October leads on the single most useful number in this study, which is active hours of darkness at 0.77 per night. Iceland in November has the clearest skies of the whole season and 14.1 hours of darkness in which to use them.
September is the month our two studies disagree about, and that disagreement is worth stating plainly. On magnetic activity, Iceland in September is excellent and effectively tied with March. On cloud cover, September is the second-worst month of the season nationally.
Inside the southeast corridor, September is the cloudiest month of all. September remains a good month to visit. September is simply the month in which the choice of base matters most.
Iceland in December presents the clearest trade-off in the data. December has the longest nights of the year and the busiest tour calendar. A traveler coming for Christmas markets and ice caves, with the aurora as a bonus, will do fine in December.
A traveler for whom the aurora is the entire reason for the trip should book the shoulder season instead. The shoulder season offers a more active sky, more mobile weather between fronts, cheaper accommodation, and quieter roads. Our guide to the best time to visit Iceland covers the rest of the seasonal trade-offs in detail.
How to Plan an Aurora Trip Around the Best Months
 The findings above translate into four practical decisions: when to book, where to sleep, how to move on a clear night, and how many nights to allow. The options below are ordered by how much they improve a traveler's odds.
Book Late February to Late March for the Strongest Overall Odds
Activity stays elevated for roughly six weeks on either side of the March equinox, so any date between late February and early April falls inside the strongest window of the year. Late February and March are the part of that window that still has enough darkness to use.
Book at least five nights, because averages describe a season and a single clouded-over week can wipe out an otherwise well-timed trip. Our study on how many days you need in Iceland reaches the same number from marketplace data, putting your chance of seeing the aurora at 76 to 95% after five nights.
October and November work on the same logic from the other side of the year. October has the most active darkness of any month, and November has the clearest skies of the season with 14.1 hours of darkness a night.
Base Yourself in the Southeast Clear-Sky Corridor
The clearest skies in Iceland run along a corridor in the southeast, from Kirkjubaejarklaustur through Jokulsarlon Glacier Lagoon and Hofn to Djupivogur. Clouds cover about 68% of the sky in an average aurora-season month at Djupivogur, the lowest figure in the country. Djupivogur recorded a mostly clear month in 36% of the winters on record.
Akureyri, which most aurora advice recommends, averages about 77% cloud cover. Akureyri reached the same clear-month threshold in only 3% of months. Lake Myvatn, at about 71%, is the strongest base in North Iceland.
One caveat from that study is worth repeating here. The clearest region in Iceland is not the driest one, because the southeast is also the wettest part of the country. Southeastern rain tends to arrive in short heavy bursts and then clear, which is what produces the clear-sky statistics.
A dark-sky property with a wake-up service matters more than a short drive from Reykjavik. The northern lights hotels category filters for exactly those two features. Our roundup of the best northern lights hotels in Iceland shows the shortlist with photos and locations.
Join a Guided Northern Lights Hunt That Drives to Clear Sky
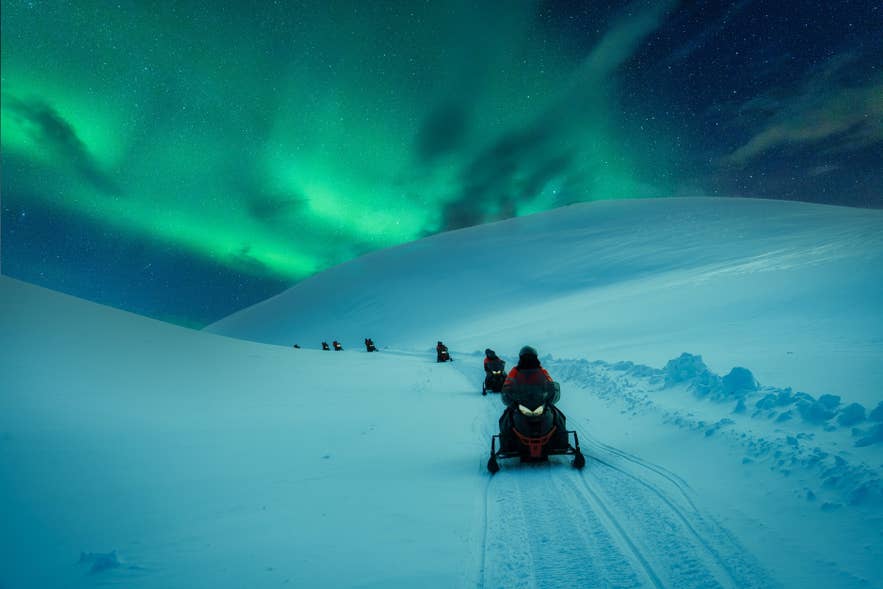
On a night with broken cloud, the difference between seeing an aurora and missing it is usually a 40-minute drive. A guided hunt has two advantages over a fixed viewing spot. The guide has been reading the same cloud maps every night for a season, and the vehicle can leave a clouded valley for a clear one.
Most northern lights tours in Iceland are built as hunts for that reason. Most operators also rebook a canceled departure rather than refund it.
Vehicle size can also be a factor. According to a satisfaction study of 475,774 tour reviews in Iceland, small-group northern lights departures, including minibus, super jeep, and private tours, average 4.51 out of 5 against 4.31 for large bus tours.
Rent a Car and Follow the Cloud Map Yourself
Independent travelers get the same advantage from a car rental in Iceland and a habit of checking the Icelandic Met Office cloud forecast each afternoon. Plan the following night around the gap in the cloud rather than around a fixed itinerary. Winter driving in Iceland requires attention to road and weather conditions, so check both before committing to a long evening drive.
For the practical mechanics of a hunt, see how to find the northern lights in Iceland and our overview of climate, weather and northern lights in Iceland. Photographers should read how to photograph the northern lights before arriving, because aurora settings are difficult to work out in the cold and dark.
Method: How We Analyzed 95 Years of Kp Data
Data Collection
The source is the Kp_ap_since_1932 series published by the GFZ Helmholtz Centre for Geosciences, Geomagnetic Observatory Niemegk, under a CC BY 4.0 license. We retrieved the series on August 28, 2026. It contains 276,584 three-hour Kp values running from January 1, 1932 to August 27, 2026, and every single interval carries a value.
Inclusion and Estimation
We included all 276,584 intervals in the analysis. The final 216 intervals, covering August 2026, are flagged by the publisher as preliminary rather than definitive, and they represent 0.08% of the record. Removing them changes no monthly figure at the precision we report.
Analysis
We computed monthly means over all intervals, and again over the night intervals of 21:00 to 03:00 UTC, since Iceland keeps UTC year-round. Confidence intervals come from a 2,000-sample bootstrap of the monthly night-hour distributions.
Solar elevation at Reykjavik, at 64.1466 degrees north and 21.9426 degrees west, was sampled every five minutes. That gives each three-hour interval a dark fraction between 0 and 1 rather than a yes or no flag. Dark means the sun sitting 10 degrees or more below the horizon, which is the point at which an aurora becomes visible.
Reporting
Kp values appear to two decimal places and hours to one decimal place. Where we quote a magnitude as a percentage we use the ap index rather than Kp, because Kp is quasi-logarithmic and its differences cannot be read as ratios. Cloud cover is reported as a share of the sky, converted from oktas, which are eighths of the sky used by meteorologists.
Results of Analysis
Table 1 lists the count of severe intervals by month, and Table 2 lists mean Kp, hours of darkness, active hours of darkness, and cloud cover for all twelve months. March records the highest mean Kp at 2.39, December the lowest at 1.94, and the 95-year mean across all months is 2.17. October records the most active darkness at 0.77 hours per night. September records the most severe intervals at 221.
Validation
Every monthly figure was recomputed independently in a second programming language before publication, and both passes agree to three decimal places. The nine-solar-cycle breakdown serves as a second validation step, because it confirms that the seasonal pattern survives when the record is cut into independent 11-year segments.
Precision
Cloud-cover figures quoted in this article come from our companion study of Best Places in Iceland to See the Northern Lights. That study analyzed 50,087 monthly cloud observations from 144 Icelandic Met Office stations, drawn from 261 station files covering 1937 to 2026. The month-by-month cloud figures in it cover the 1961 to 2010 baseline period.
Skies over Iceland have grown cloudier since that baseline. Across the stations with continuous records, every month of the aurora season now averages 1 to 4 percentage points more cloud than it did over 1961 to 2010. The largest increases fall in January and February.
The month-by-month ranking still holds and November is still the clearest month of the season, so read the cloud values as a ranking rather than as current absolute figures.
Conclusion: The Best Month for Northern Lights in Iceland Based on Historic Kp Data
 Ninety-five years of geomagnetic records point to late February through late March, and to October and November, as the best months to see the northern lights in Iceland. March is the strongest single month, because March is the only month that scores well on all three requirements at the same time.
December, the month most often recommended, has the longest nights and the weakest magnetic activity of the entire aurora season.
The month is only the first of three decisions, and it is the one with the smallest effect. The region a traveler bases themselves in matters more, which is the question our study of Best Places in Iceland to See the Northern Lights was built to answer.
Being willing to drive toward a gap in the cloud matters most of all. Our guide to seeing the northern lights in Iceland covers the time of night, the forecasting tools, and the practical tips that sit outside this dataset.
Booking inside the strongest window, basing yourself in the southeast corridor, and allowing at least five nights turns a coin flip into a favorable bet. It does not turn it into a certainty, and no dataset ever will.

Guide to Iceland Editorials is the shared byline for our content team. We use it on pieces several people worked on together, where no single writer owns the article, and on anything rewritten often enough that a personal byline would be misleading.
Everything published under it is researched and reviewed by people who live and work in Iceland. If you spot something out of date or want to suggest a correction, message us and it reaches the whole team.